Colour cells in t-SNE space by percentile gene expression
Source:R/feature_plots.R
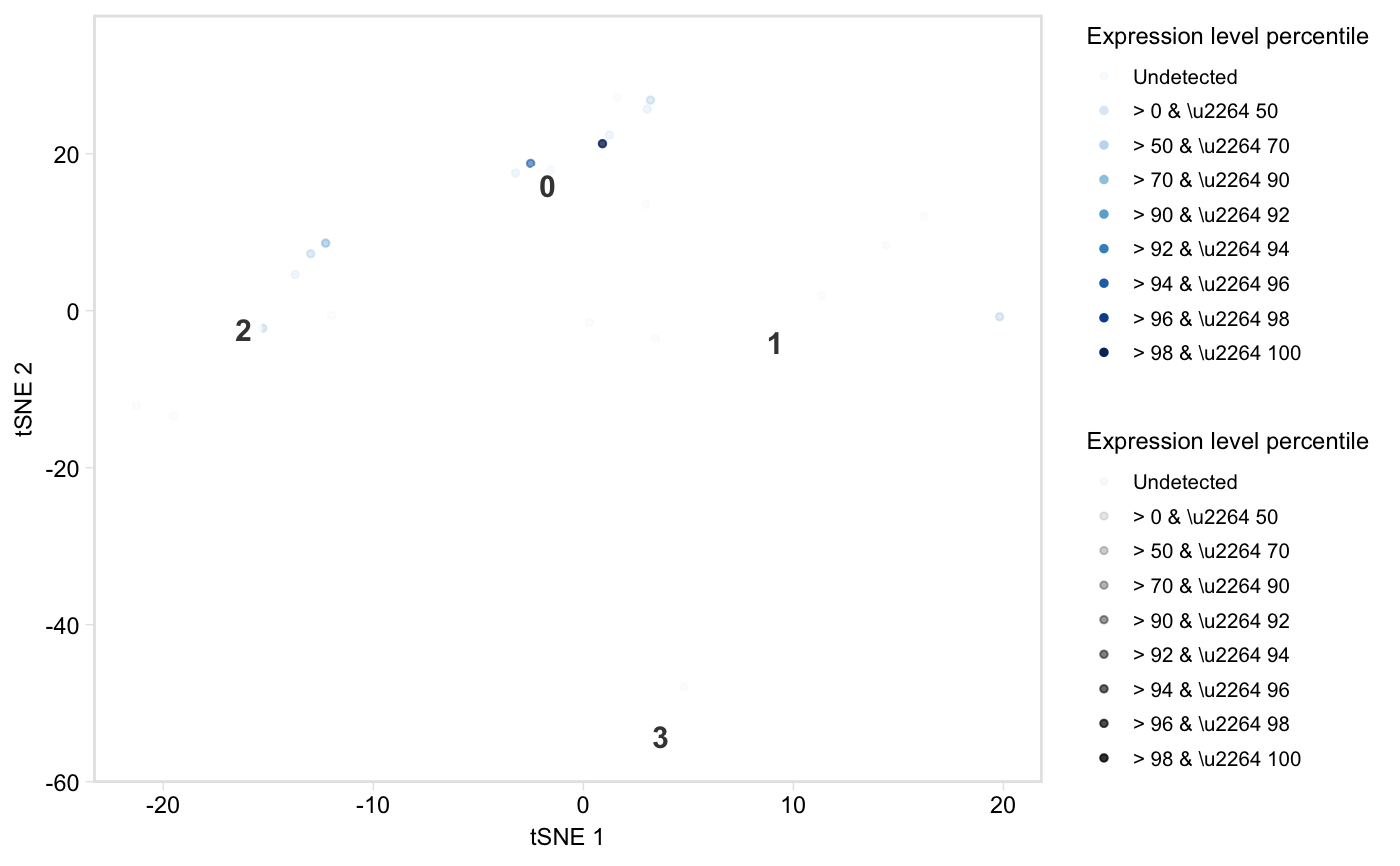
tsneByPercentileMarkerExpression.RdPlot a low-dimensional embedding of the cells, coloured by expression percentile of a gene, of the total expression of a group of marker genes.
tsneByPercentileMarkerExpression(seurat, genes, reduction = "tsne",
  label = TRUE, palette = "blues", title = NULL, alpha = TRUE,
  legend = TRUE, legend_options = "percentiles", point_size = 1,
  label_repel = TRUE, label_size = 4, extra = FALSE,
  verbose = FALSE, hide_ticks = FALSE, label_short = FALSE,
  dim1 = 1, dim2 = 2)
Arguments
| seurat | Seurat object, where dimensionality reduction has been applied, i.e. (after applying Seurat::RunPCA() or Seurat::RunTSNE() to the object) |
|---|---|
| genes | String or character vector specifying gene(s) to use |
| label | Logical, whether to label clusters on the plot. Default: TRUE. |
| palette | String or character vector. If a string, one of "viridis", "blues", or "redgrey", specifying which gradient palette to use. Otherwise, a character vector of colours (from low to high) to interpolate to create the scael. Default: "blues". |
| title | (Optional) string used as title for the plot. |
| alpha | Logical, whether to vary the alpha (point opacity) with percentile group to highlight cells in the top percentiles. If FALSE, sets a fixed opacity of 0.8. Default: TRUE. |
| legend | Logical, whether to plot the legend. Default: FALSE. |
| legend_options | String, "percentiles" or "values". Default: "percentiles". |
| point_size | Numeric, size of points in scatterplot. Default: 1. (A smaller value around 0.5 is better for plots which will be viewed at small scale.) |
| label_repel | Logical, if |
| label_size | Numeric, controls the size of text labels. Default: 4. |
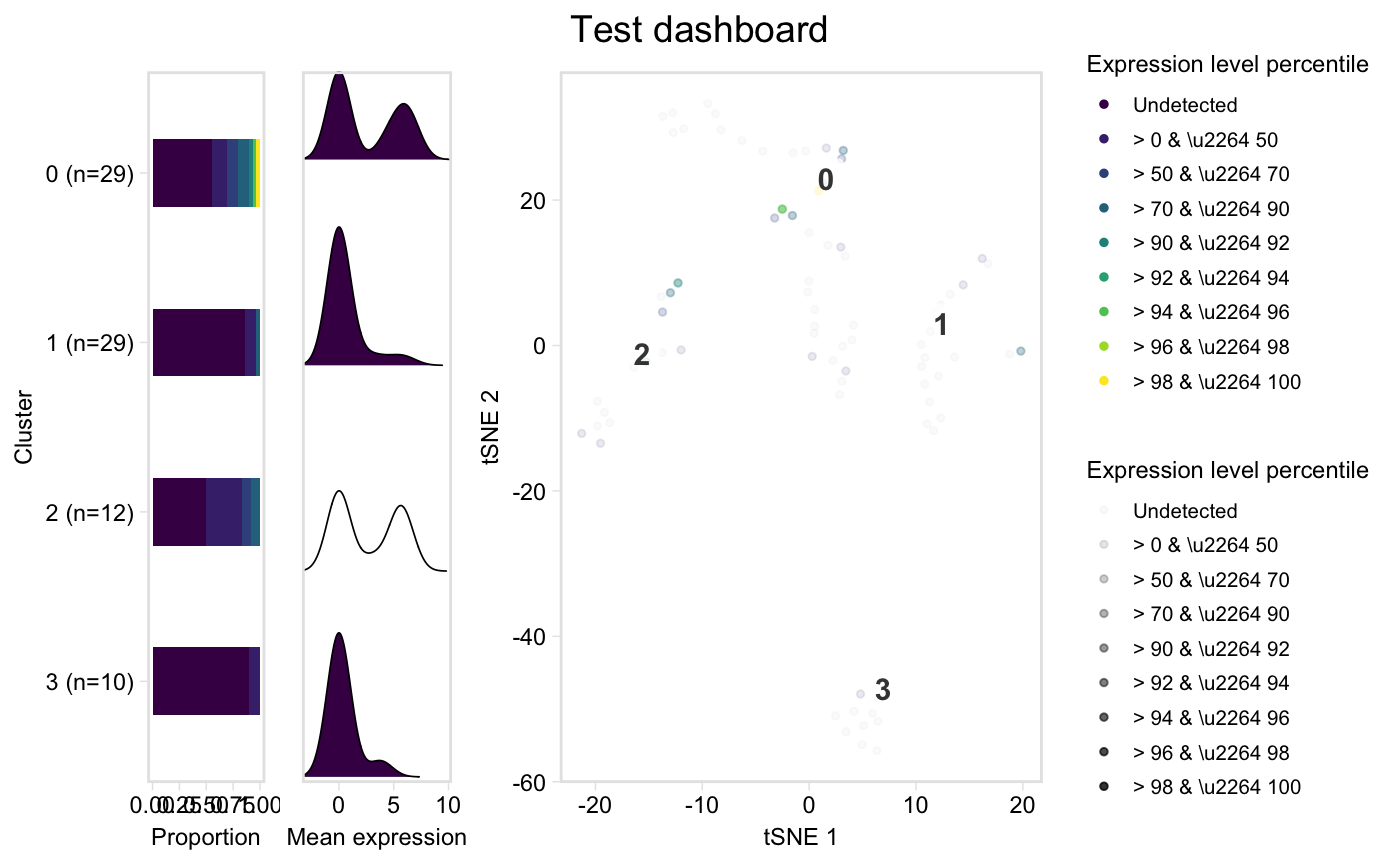
| extra | Logical, plot a detailed three-panel plot, where the first
is a proportional bar plot of cells in each cluster in each percentile
group, the second is a ridge plot showing density in each cluster of the mean
expression of the markers (coloured by median percentile group within the
cluster), and the third is the labelled tSNE plot coloured
by percentiles. Requires |
| verbose | Logical, whether to print status updates. Default: FALSE. |
| hide_ticks | Logical, whether to hide axis ticks. Default: FALSE |
| label_short | (Optional/Experimental!!) Logical, if TRUE, assumes clusters
(at seurat@ident) consist of a prefix and a suffix separated by a non-alpha
numeric character ( |
Value
A ggplot object
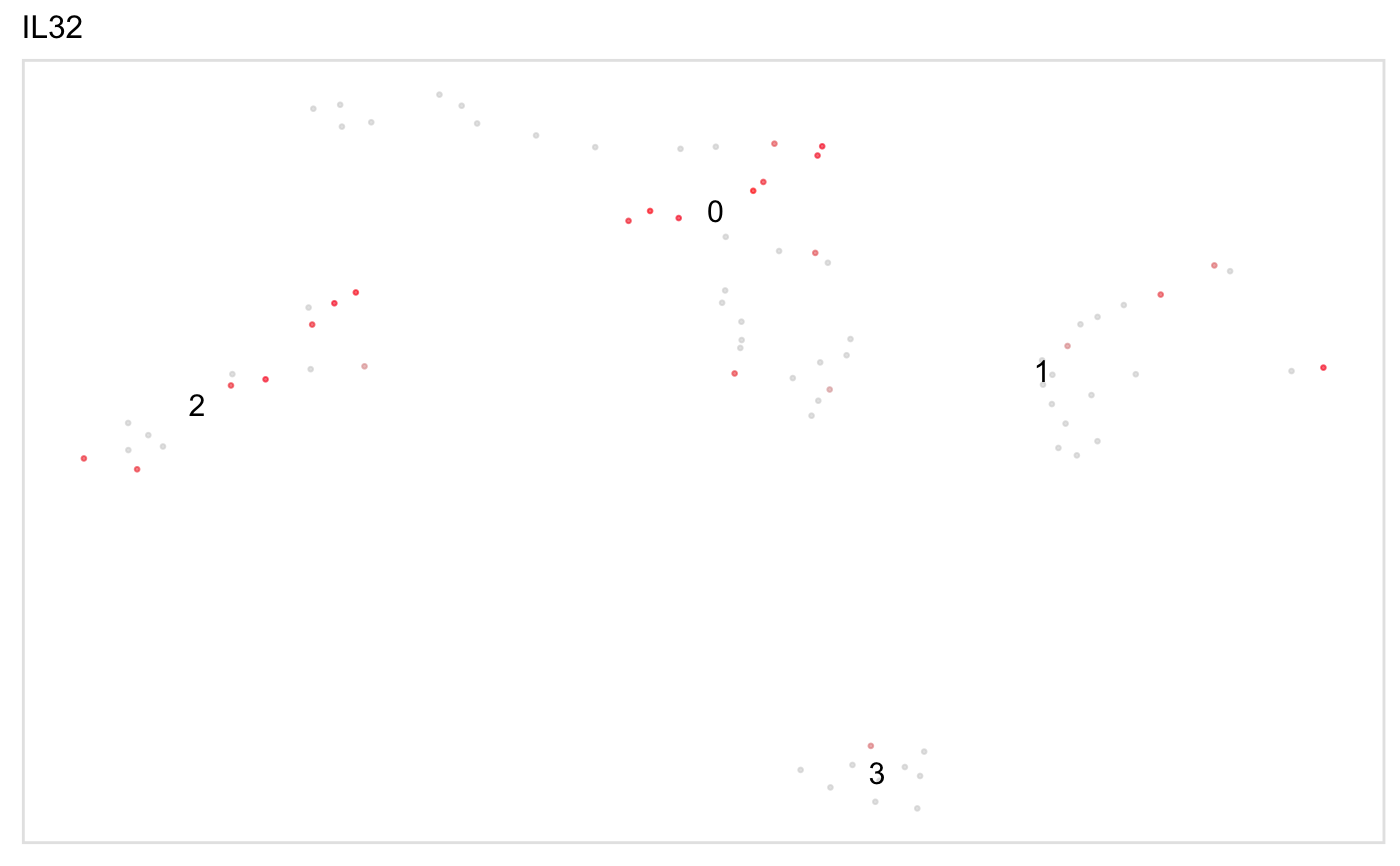
Examples
tsneByPercentileMarkerExpression(pbmc, "IL32")dashboard(pbmc, "IL32", title = "Test dashboard")#> Warning: Column `Cell` joining character vector and factor, coercing into character vector#>