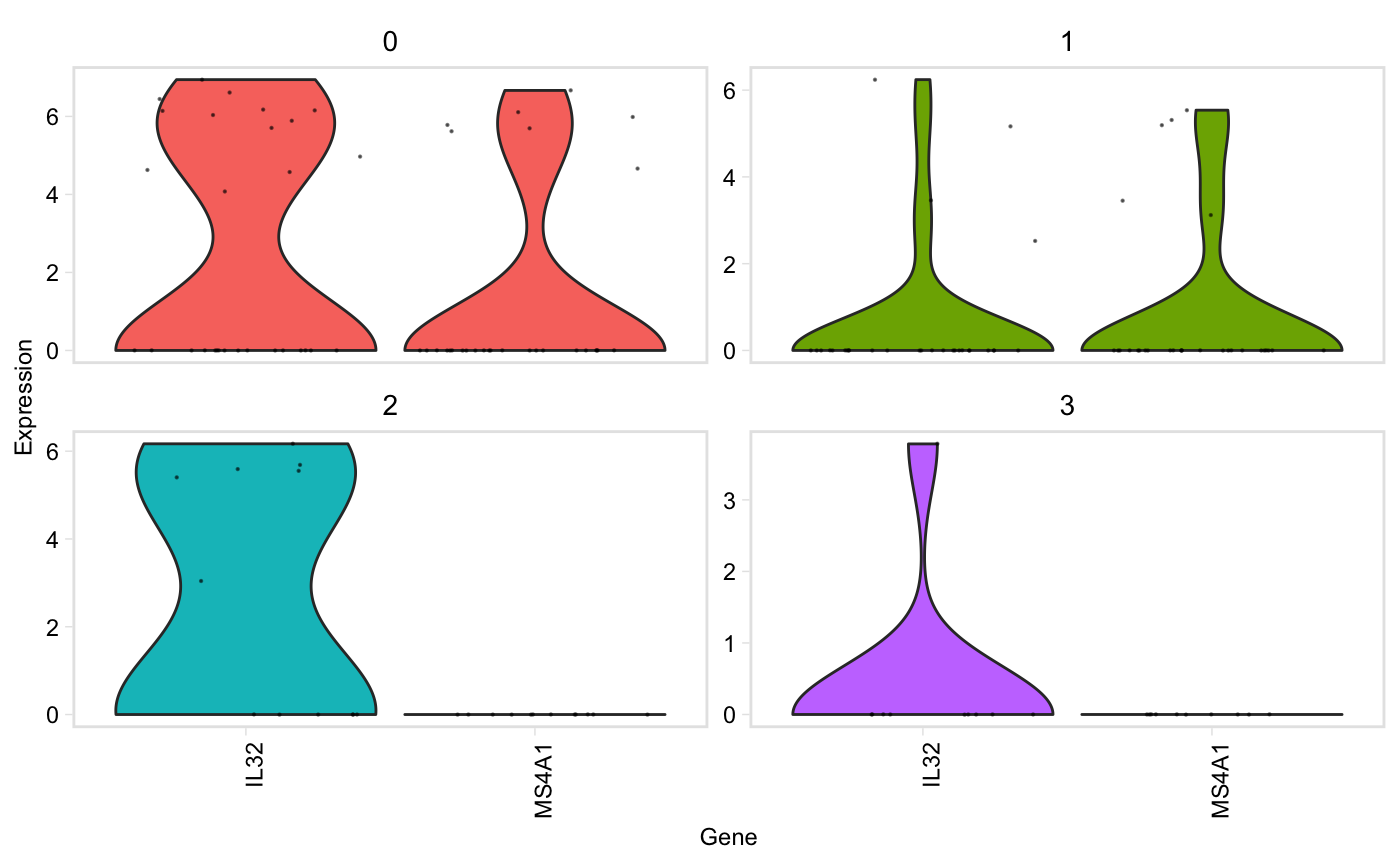
Similar to Seurat::VlnPlot() except it prints genes that are not found in the data, but continues plotting without error, and has a (default) option to group plots by cluster instead of gene.
vln(seurat, genes, facet_by = "cluster", point_size = 0.1,
  adjust = 1)
Arguments
| seurat | Seurat object |
|---|---|
| genes | Genes to plot violins for |
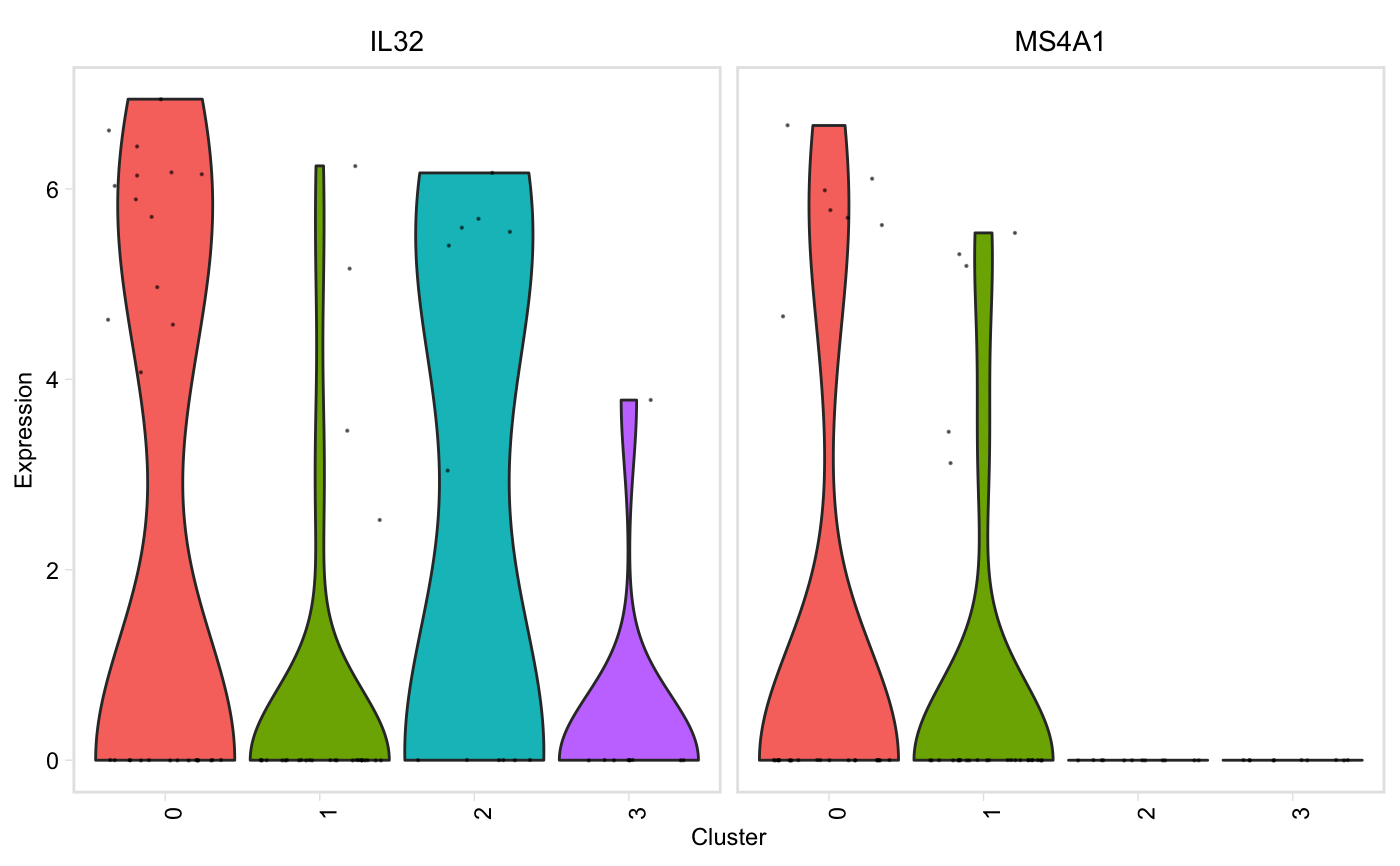
| facet_by | String, one of "gene" or "cluster". Default: "cluster", genes will be on the x axis, and there will be one plot per cluster. If "gene", clusters will be on the x axis, and there will be one plot per gene (akin to Seurat::VlnPlot) |
| point_size | Numeric value for point size, use -1 to hide points. Default: 0.1. |
| adjust | Bandwidth for density estimation, passed to |
Value
A ggplot2 object