Generate a grid of tiny violins of gene expression in each cluster
Source:R/feature_plots.R
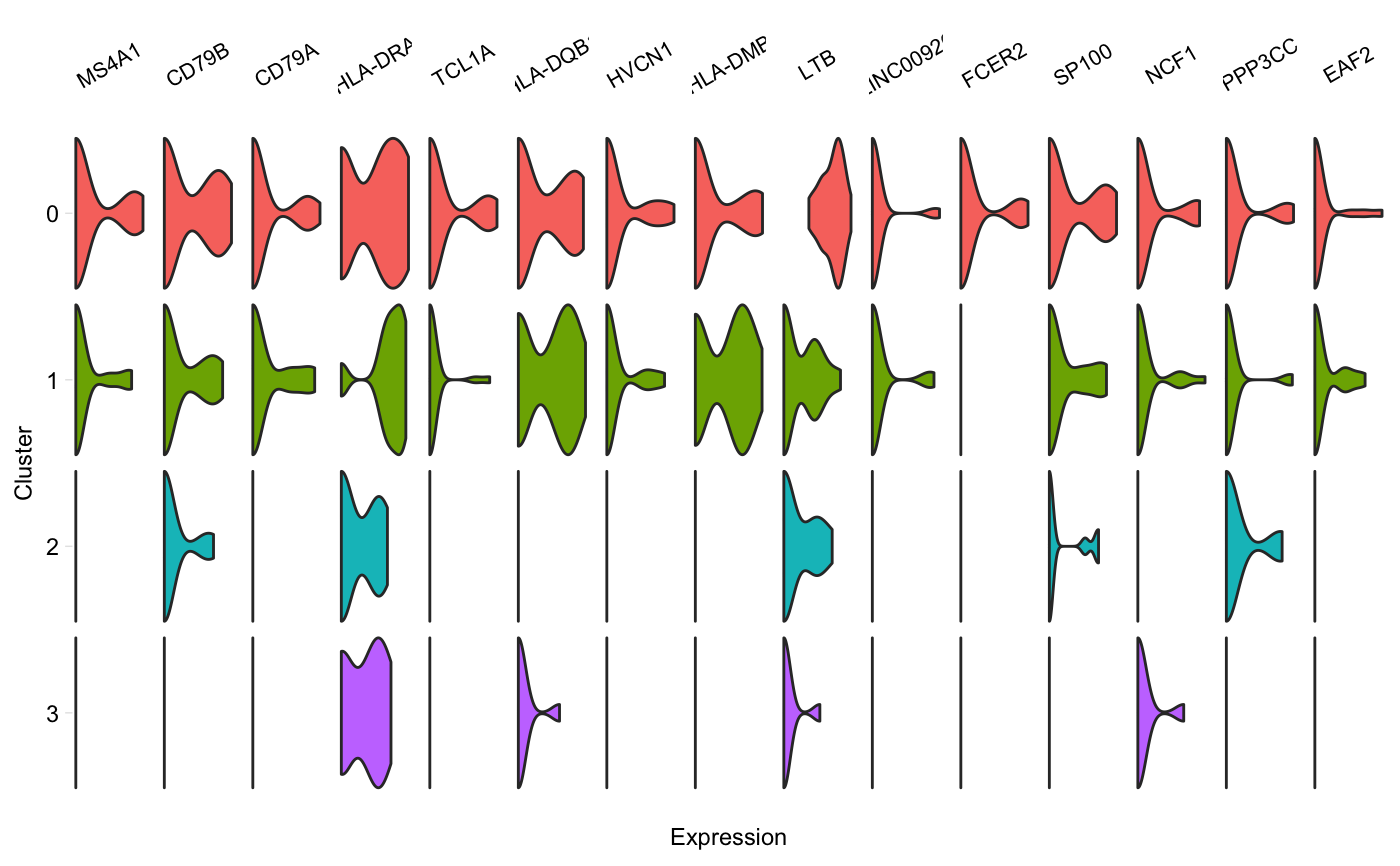
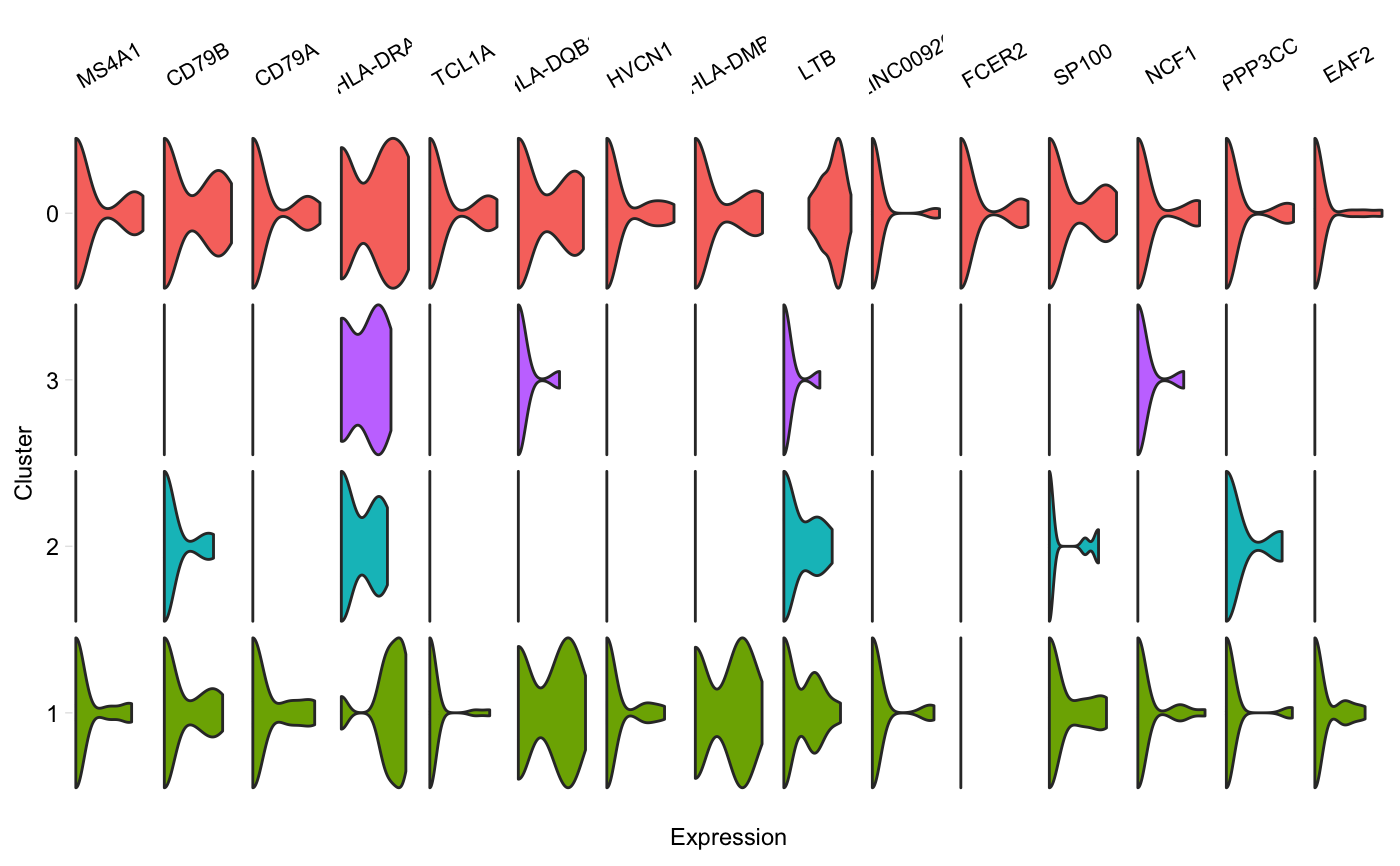
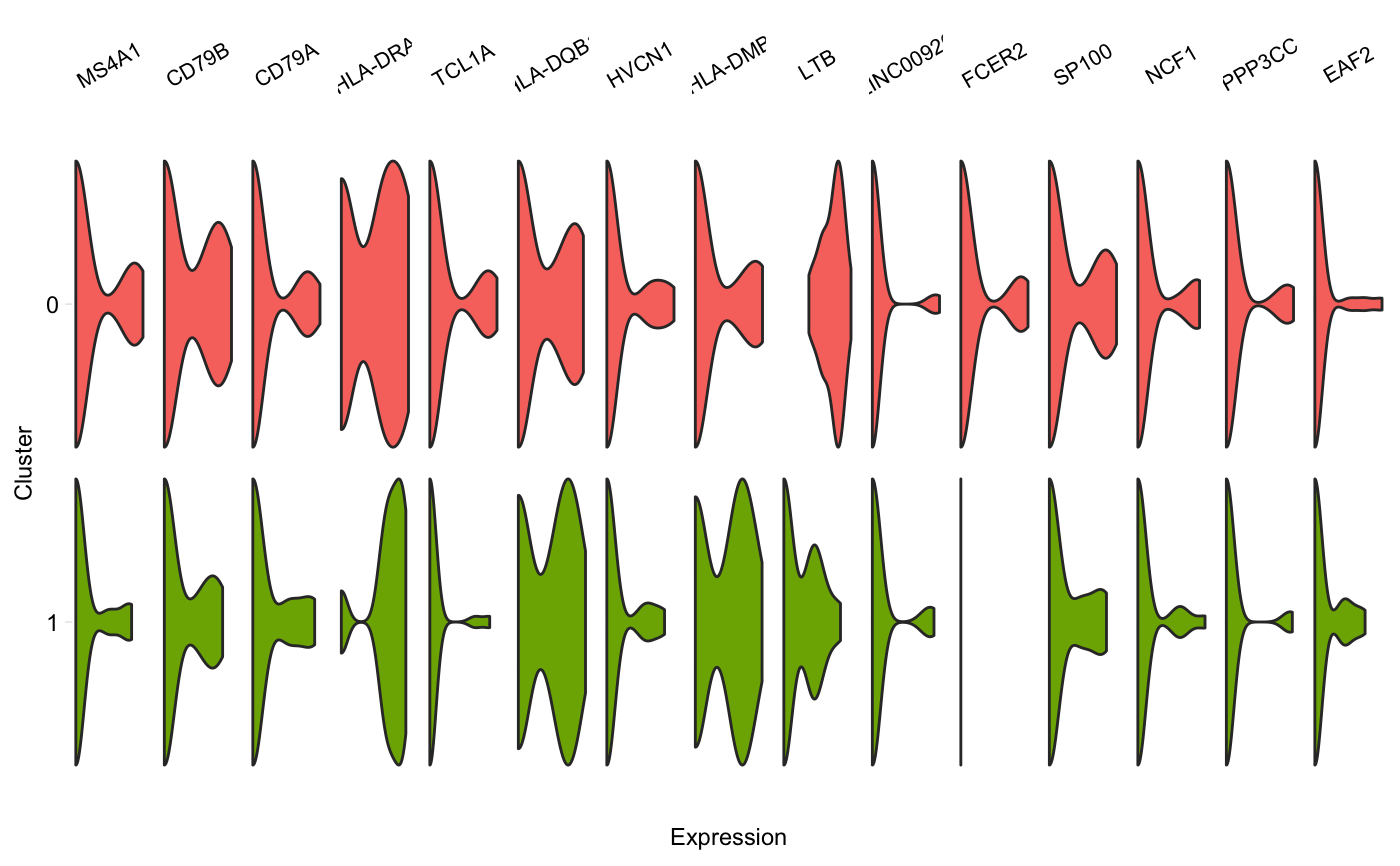
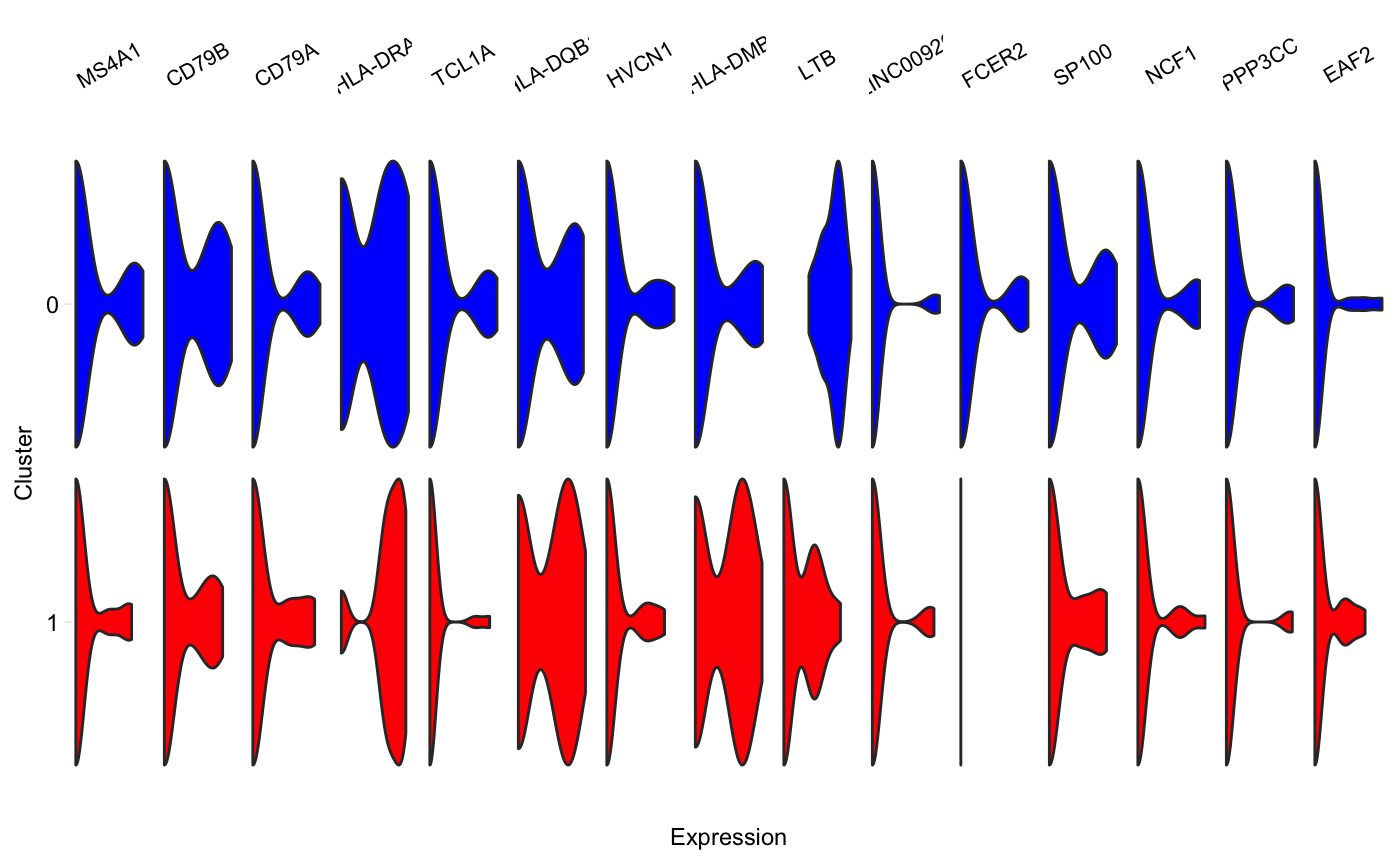
vlnGrid.RdA grid of small violin plots, one plot per gene per cluster, similar to Figure 5D in the Drop-seq paper by Macosko et al. Aka "fish plot".
vlnGrid(seurat, genes, subset_clusters = NULL, order = "genes",
  colours = NULL, scale = "width", title = NULL, scales = "free_x")
Arguments
| seurat | Seurat object |
|---|---|
| genes | Genes to plot violins for, in the order (left to right) in which they should be plotted. |
| subset_clusters | (Optional) Vector of clusters to include on the plot. |
| order | Either "genes", or a vector containing the clusters in the order
they should be plotted (from top to bottom). If "genes", clusters will be sorted
in decreasing order of their median expression* of these genes, in the order
in which they're provided. Passing a vector will cause clusters to be plot
in that order. Default: "genes". *We take the median of cells with non-zero
expression values (in |
| colours | (Optional) Vector of colours to use. Either one colour
per cluster, in the order of |
| scales | See |
| width | String, one of "width", "area", or "count". From the ggplot2
documentation of |
Value
A ggplot2 object
Examples
# Plot only a subset of clusters vlnGrid(pbmc, head(rownames(pbmc@data), 15), subset_clusters = c(0, 1))# Specify colours vlnGrid(pbmc, head(rownames(pbmc@data), 15), subset_clusters = c(0, 1), colours = c("red", "blue"))