HGG-oncohistones
Analysis for "K27M in canonical and noncanonical H3 variants occurs in distinct oligodendroglial cell lineages in brain midline gliomas" (Jessa et al, Nature Genetics, 2022)
![]()
HGG-oncohistones analysis code
- This is the public repository accompanying the study K27M in canonical and noncanonical H3 variants occurs in distinct oligodendroglial cell lineages in brain midline gliomas, Jessa, Mohammadnia, Harutyunyan*, …, Jabado, Kleinman, Nature Genetics, 2022
- Link to repository: https://github.com/fungenomics/HGG-oncohistones and rendered version: https://fungenomics.github.io/HGG-oncohistones/
- This repository is archived on Zenodo
- This repository contains primarily code, with some figure source data, see the Data availability section for links to data
- Jump to the Code to reproduce figures section for links to code and rendered HTMLs of each figure
Contents:
- Contents of the repository
- Materials for the manuscript
- Processed single-cell data
- Re-analysis of human fetal brain scRNAseq data
- Data availability
- Notes for reproducibility
- Citation
Contents of this repository
Codebase overview
- This repository is meant to enhance the Materials & Methods section by providing code for the custom analyses in the manuscript and the exact R dependencies, in order to improve reproducibility for the main results. However, it is not a fully executable workflow.
- In general, read alignment and cell calling for tumor and normal brain single-cell sequencing data has been performed using in-house pipelines, not included here. This repository mainly contains custom/downstream code.
- A first level of downstream analysis involves scripts applied in parallel to individual samples for specific data types.
Copies of these scripts are provided in the
code/scripts/andR-4/code/scriptsfolders (the execution of these scripts is perofrmed in thedata/scRNAseq,data/scATACseq,data/ChIPseq, etc folders, not included here). - A second level of downstream analysis involves custom analyses, aggregating samples and data types, use to derive the main results included in the paper. These are provided in .Rmd files in
codeandR-4/code, with the associated .md and rendered HTML files. The rendered HTML files can be viewed at https://fungenomics.github.io/HGG-oncohistones/ under the “Code to reproduce key analyses” section.
Codebase structure
Brief explanation of the directory structure:
renv–> renv-managed folder for R 3.6renv.lock–> lockfile containing all package versions for R 3.6 analysiscode–> code for R 3.6 analysis, contains the .Rmd files that run the high-level analyses and produce figures included in the paperfunctions–> contains .R files with custom functions used throughout the analysisscripts–> contains .R and bash scripts for analyses that are repeated on individual samples, as well as helper scripts e.g. for creating referencesinfos_templates–> contains example config files for scripts in thescriptsfolderseurat_v3_resources–> this is a copy of the folder referenced bySEURAT_V3_ASSETSin certain bash scripts, orfile.path(params$assets, "resources")in the variouspreprocessing_*.Rmdscripts. It contains resources used for single-cell preprocessing.
R-4–> code for R 4.1 analysis (has a similar directory structure as the above main directory)code–> contains .Rmd files, functions, and scripts for R 4.1 analysisrenv–> renv-managed folder for R 4.1renv.lock–> lockfile containing all package version for R 4.1 analysis
include–> contains templates, palettes, etc, for this repositoryrr_helpers.R–> contains helper functions for working with this GitHub repository template (rr)
Materials for the manuscript
Code to reproduce key analyses
Code to reproduce analyses is saved in code and R-4/code.
(See here for why two different R versions are used.) When these analyses depend
on inputs from pipelines, I’ve tried to note within the R Markdown documents where
these scripts/pipelines are located.
This table contains pointers to code for the key analyses associated with each figure. The links in the Analysis column lead to rendered HTMLs.
| Figure | Analysis | Path |
|---|---|---|
| Fig 1 | Oncoprints summarizing tumor and cell line cohort | ./code/00-oncoprints.Rmd |
| Ext Fig 1 | Summary figures for extended mouse brain scRNAseq atlas | ./code/05-mouse_atlas.Rmd |
| Fig 1, Ext Fig 2 | cNMF analysis of variable gene programs | ./R-4/code/01-cNMF_programs.Rmd |
| Fig 1 | Cell type identity in tumors with automated consensus projections | ./R-4/code/02-consensus_projections.Rmd |
| Ext Fig 2 | Analysis of human fetal thalamus and hindbrain scRNAseq data | ./code/01A-human_thalamus.{Rmd,html} and ./code/01B-human_hindbrain.{Rmd,html} |
| Ext Fig 2 | Validation of cell type projections using human thalamic fetal brain reference | ./R-4/code/02-consensus_projections.Rmd |
| Ext Fig 3 | Characterization of malignant ependymal cells | ./code/01C-ependymal_cells.Rmd |
| Fig 2, 4 | Scatterplots for RNAseq/K27ac/K27me3 between H3K27M tumor subtypes | ./code/02-bulk_comparisons.Rmd |
| Fig 2, Ext Fig 4 | Systematic HOX analysis/quantification | ./code/03A-HOX.Rmd |
| Fig 3 | Analysis of thalamic patterning | ./code/04-thalamus.Rmd |
| Fig 4-6, Ext Fig 4-6 | Analysis of dorsal-ventral patterning and NKX6-1/PAX3 activation | ./code/03B-NKX61_PAX3.Rmd |
| Fig 6 | Analysis of ACVR1 cell lines | ./code/06-ACVR1.Rmd |
| Fig 7, 8, Ext Fig 7 | Analysis of histone marks in tumors & cell lines | ./code/07A-histone_marks.Rmd |
| Ext Fig 8 | Comparison of tumor epigenomes to scChIP of normal cell types | ./R-4/code/03A-celltype_epigenomic_similarity.Rmd |
| Fig 8, Ext Fig 9 | Heatmaps of H3K27me2/3 in CRISPR experiments | ./code/07D-deeptools_*.sh and ./code/07E-deeptools_*.sh |
Palettes & custom plotting utilities
Most color palettes (e.g. for tumor groups, genotypes, locations, cell types, HOX genes, etc) and ggplot2
theme elements (theme_min(), no_legend(), rotate_x(), etc) are defined in include/style.R.
Tables
Supplementary tables (included with the manuscript) and processed data tables (on Zenodo) were assembled from the following input/output/figure source data files. (Only tables produced with the code included here are listed below.)
| Supplementary table | Path |
|---|---|
| 6 | ./output/05/TABLE_mouse_sample_info.tsv |
| 7 | ./output/05/TABLE_mouse_cluster_info.tsv |
| 8 | ./R-4/output/02/TABLE_cNMF_programs_per_sample.tsv |
| 9 | ./R-4/output/02/cNMF_metaprogram_signatures.malignant_filt.tsv |
| 10 | ./R-4/output/02/TABLE_reference_cnmf_program_overlaps.tsv |
| 11 | ./output/01A/TABLE_thalamus_QC.tsv and ./output/01B/TABLE_hindbrain_QC.tsv |
| 12 | ./output/01A/info_clusters3.tsv and ./output/01B/info_clusters3.tsv |
| 13 | ./output/03A/TABLE_HOX_expression_per_transcript.tsv |
| 14 | ./output/03A/TABLE_HOX_H3K27ac_H3K27me3_per_transcript.tsv |
| 16 | ./figures/03B/enhancer_diff-1.source_data.tsv |
| Processed data table | Path |
|---|---|
| 1a | ./output/02/TABLE_bulk_counts.tsv |
| 1b | ./output/02/TABLE_dge_H3.1_vs_H3.3.tsv |
| 1c | ./output/02/TABLE_dge_thal_vs_pons.tsv |
| 2a | ./output/07A/TABLE_K27me3_CGIs.tsv |
| 2b | ./output/07A/TABLE_K27me2_100kb_bins.tsv |
| 3a | ./output/02/TABLE_promoter_H3K27ac_H3K27me3_per_sample.tsv |
Processed single-cell data
This section describes the scripts used for preprocessing of single-cell data from this project. That includes: sn/scRNAseq, scATACseq, and scMultiome (joint RNA & ATAC in the same cells). This document refers to sn and scRNAseq generally as ‘scRNAseq’. Please see the sample metadata for the technology used to profile each sample. Please see the Methods section of the manuscript for more details on the single-cell profiling.
Single-cell RNAseq data
The pipeline for scRNAseq processing applied per-sample is summarized in this schematic. In general, scripts contain the code to run the analysis and config files contain the parameters or setting specific to a certain iteration of the analysis.
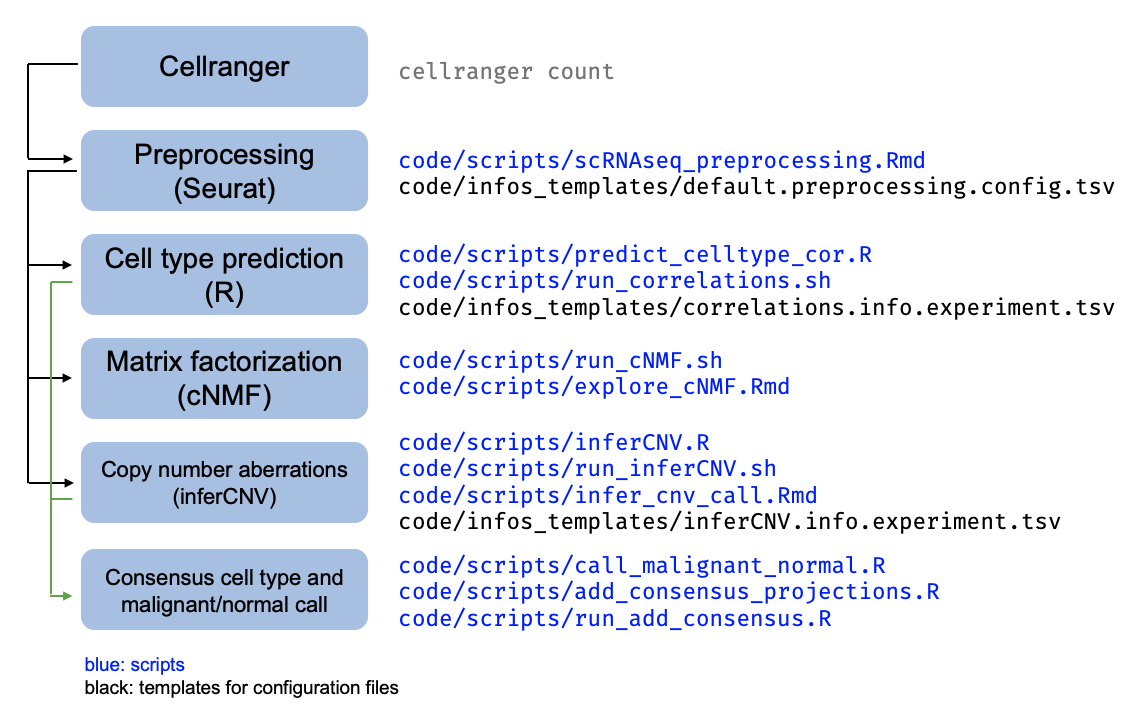
Following Cellranger, the scRNAseq samples have all been processed with the
lab’s preprocessing workflow (./code/scripts/scRNAseq_preprocessing.Rmd).
Each sample is then subject to several downstream analyses as described in the schematic above,
with the associated scripts indicated.
Single-cell ATACseq data
The pipeline for scATACseq processing applied per-sample is summarized in this schematic:
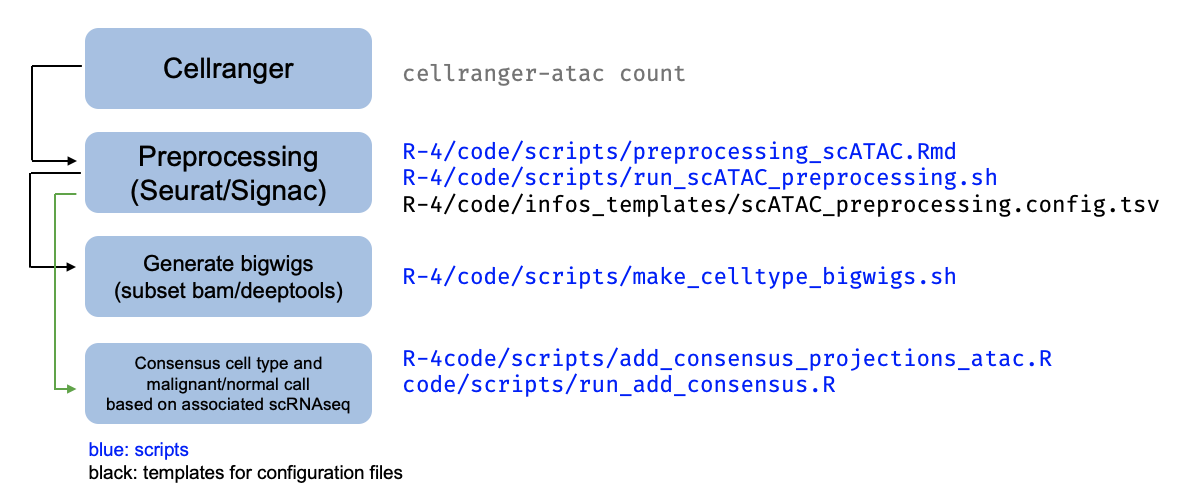
Following Cellranger, preprocessing of the scATAC data is done with a script that
builds off the scRNAseq workflow, at ./R-4/code/scripts/preprocessing_scATAC.Rmd.
This workflow is run in the scATAC pipeline at ./R-4/data/scATACseq/pipeline_10X_ATAC,
with one folder per sample. Each sample is then subject to several downstream analyses
as described in the schematic above, run in that sample’s folder, with the associated scripts.
Single-cell Multiome data
The pipeline for scMultiome processing applied per-sample is summarized in this schematic:

Following Cellranger, preprocessing of the scMultiome data is done with a script that builds off the scRNAseq workflow, at ./R-4/code/scripts/preprocessing_scMultiome.Rmd.
This workflow is run in the scMultiome pipeline at ./R-4/data/scMultiome/pipeline_10X_Multiome, with one folder per sample. Each sample is then subject to several downstream analyses
as described in the schematic above, run in that sample’s folder, with the associated scripts.
Cell annotations matching the paper
For scRNAseq, scATACseq and scMultiome samples, the cell metadata provided with the paper contains several columns matching the analyses used in the paper:
Cell_type_granular_mouse_correlations–> cell-type projection to the extended mouse atlas, based on the Spearman correlation, using the cluster label (REGION-TIMEPOINT_CLUSTER)Cell_type_mouse_correlations–> cell-type projection to the extended mouse atlas, based on the Spearman correlation, summarized to a broader cell class (ontology is described in Table S7)Cell_type_consensus_Jessa2022–> consensus cell-type projection to the extended mouse atlas, based on agreement between Spearman correlation and at least one other cell-type projection method. Cells without a consensus are classified as “Uncertain”, see Methods for detailsMalignant_normal_consensus_Jessa2022–> assignment as normal or malignant, used to decide whether cells should be included in downstream analyses
The cell annotations/metadata are included in processed data deposition on Zenodo and on GEO (GSE210568).
Data integration
As described in the Methods, we used the harmony package for integration of single-cell datasets.
- Samples within each subgroup were integrated, using “Sample” and “Technology” as the batch variables
- Only malignant cells were used, and only the RNA modality was used for integration
- The general script used for integration is at
code/scripts/integrate_harmony.R, which expects a config fileinfo.experiment.tsvto be present (example atcode/infos_templates/harmony.info.experiment.tsv) - Integrations were performed at
R-4/data/integrations, with one directory for each group of samples being integrated, and the config files within
Human fetal brain scRNAseq data
Human fetal data brain data for the hindbrain and thalamus were obtained from two studies, Eze et al, Nature Neuroscience, 2021, and Bhaduri et al, Nature, 2021.
- The count matrices for each sample, as produced by Cellranger, were downloaded from the BICCN repository.
- The data was processed using the scRNAseq preprocessing workflow as described above for human tumor samples (
./code/scripts/scRNAseq_preprocessing.Rmd) - Thalamic samples were labelled using the published cluster labels, together with manual correction based on known cell type markers (performed in
./code/01A_2-human_thalamus.{Rmd,html}) - Hindbrain samples were labelled by projection to the mouse atlas (described in
./code/01B-human_hindbrain.{Rmd,html})
Data availability
- For scRNA-seq data for normal E10, E13, E16 and E18 murine samples, data has been deposited to GEO (GSE188625), whereas E12, E15, P0, P3 and P6 samples have been previously deposited to GEO (GSE133531) as part of Jessa et al, Nature Genetics, 2019.
- For tumor samples and patient-derived cell lines, please see the associated Zenodo record or for the processed data including counts matrices, cell annotations, and genome wide histone mark levels. The counts and cell annotations are also deposited to GEO deposition (GSE210568).
- Raw data have been deposited to GEO (GSE188625) and EGA (EGAS00001005773)
Notes for reproducibility
rr template & helpers
This repository uses the rr template, which contains
a set of R markdown templates to help me ensure reproducibility. Secondly, this also
provides a set of helper functions (located in rr_helpers.R and prefixed by rr_ in the
function name) to help encourage documentation.
R and R package versions
The R libraries for this project are managed with the package renv.
The R versions used are 3.6.1 and 4.1.2, and renv manages one library
for each R version.
The renv package:
- maintains two isolated project-specific libraries in the
renvfolder (for R 3.6.1) orR-4/renvfolder (for R 4.1.2) - the libraries themselves are not on GitHub - stores packages according to version
- records the R, Bioconductor, and package versions in the files
renv.lockandR-4/renv.lock, which can be used to reproduce the R package environment.
The reason for using two different R versions is that certain analyses involving 10X Multiome data require versions of Seurat/Signac dependent on R > 4.
R Markdown
Each markdown/HTML file has a “Reproducibility report” at the bottom (example), indicating when the document was last rendered, the most recent git commit when it was rendered, the seed, and the R session info.
Testing
Lightweight testing is performed in certain cases (e.g. validating metadata)
using the ensurer package, combined with the
testrmd testing framework for R Markdown documents.
Certain reusable ensurer contracts (reusable tests) are stored in ./code/functions/testing.R.
GitHub / version control
The following are tracked / available on GitHub:
.Rmdfiles, containing the code, and.mdand rendered HTML files, containing code and outputs- Figure source data, under
figures, when sufficiently small - The brief
descfiles for outputs, underoutputs - The lockfile produced by the
renvpackage
The following are not tracked / available on GitHub:
- Figures in
png/pdfformat, and some figure source data - Raw data and analysis output / processed data files (but see the “Data availability” section for links to data depositions)
- The actual packages in the R library
Citation
If you use or modify code provided here, please cite this work as follows:
Selin Jessa, Steven Hébert, Samantha Worme, Hussein Lakkis, Maud Hulswit, Srinidhi Varadharajan, Nisha Kabir, and Claudia L. Kleinman. (2022). HGG-oncohistones analysis code. Zenodo. https://doi.org/10.5281/zenodo.6647837